
Quantitative proteomics: label-free quantitation of proteins
Published:
Updated on September 13, 2021
Liquid chromatography (LC) coupled with mass spectrometry (MS) is a powerful method for quantifying protein expression. In tandem mass spectrometry (MS/MS), protein quantification is based on the integrated peak intensity of either the parent-ion mass (MS1) or features from fragment-ions (MS2).
A widely used approach for protein quantification is label-free quantification (LFQ), which can be based on either precursor ion intensity (peak areas or peak heights) or spectral counting. One of the key algorithms used in LFQ is MaxLFQ, which measures chromatographic ion intensities to compare protein levels across samples.
iBAQ and LFQ Intensity
iBAQ (Intensity-Based Absolute Quantification):
In MS1-based methods, protein quantification often uses the iBAQ. iBAQ intensity is calculated by dividing a protein’s total non-normalized intensity (sum of all peptide intensities) by the number of measurable tryptic peptides. This method provides a measure of the protein’s absolute abundance.
iBAQ = Σintensity / #theoretical peptides
LFQ (Label-Free Quantification):
LFQ intensity is similar to iBAQ but applies normalization to exclude outliers, providing more accurate ratios of protein abundance between different samples. This normalization is crucial for ensuring reliable comparison of protein levels across biological samples. Takes into account retention time and aligns peptide peaks between different samples.
Untargeted label-free quantitation (LFQ) aims to determine the relative amount of proteins in two or more biological samples without prior labeling. Raw data files generated by the mass spectrometer are used for this process. For quality control, base peak chromatograms can be visually inspected using tools like RawMeat, a data quality assessment tool specifically designed for Thermo instruments.
1. MaxQuant Search
MaxQuant is a widely used computational platform designed for analyzing mass spectrometry (MS) data, particularly in the field of quantitative proteomics. It processes data from Liquid Chromatography coupled with Tandem Mass Spectrometry (LC-MS/MS) experiments, helping to identify and quantify proteins in complex samples. The tool is especially valuable for label-free quantification, SILAC (Stable Isotope Labeling by Amino acids in Cell culture), and TMT (Tandem Mass Tags) based proteomics.
All raw files are processed together in a single run by MaxQuant v1.6.15.0 1 with default parameters except the following
Raw data pane
- Load all raw data files of a single run.
- Select a sample file(s) and edit
Set experimentto assign a unique ID. If you don´t assign a unique ID to each biological sample, MaxQuant will put them together in the output. - Select a sample file and edit
Set fractionsto assign fraction value. If you don’t have a fractionation, set 1. - Number of processors: 4 (depends on your computer)
Group-specific parameters pane
- Type: Standard and Multiplicity: 1
- Modifications:
a. Variable modifications: Oxidation(M); Acetyl (Protein N-term); Deamidation (NQ)
b. Fixed modifications: Carbamidomethyl (C) - Digestion: trypsin
- Instrument: Orbitrap
- Label-free quantification: LFQ (LFQ min. ratio count: 2)
Global parameters pane
- Sequences:
a. Add D:\Proteomics\HUMAN.fasta (download it from UNIPROT)
b. Identifier rule: Uniprot identifier
c. Min. peptide length: 6
d. Max. peptide mass [Da]: 6000 - Protein quantification:
a. Label min. ratio count: 1
b. Peptides for quantification: Unique+razor
c. Modifications used in protein quantification: Oxidation(M); Acetyl (Protein N-term); Deamidation (NQ)
d. Discard unmodified counterpart peptides: FALSE - Tables
a. Write msScans tabls: TRUE - MS/MS analyzer
a. FTMS MS/MS match tolerance: 0.05 Da
b. ITMS MS/MS match tolerance: 0.6 Da - Identification:
a. Match between runs: TRUE (optional)
b. Find dependent peptides: FALSE
c. Razor protein FDR: TRUE - Label free quantification
a. iBAQ: TRUE
b. Separate LFQ in parameter groups: TRUE - Folder locations
a. Combine folder location: D:\results (optional)
Match between runs: Peptides, which are present in several samples, but not identified via MS/MS in all of them, can still be identified via matching between runs. Setting TRUE will boosts number of identifications.
Database searches are performed using the Andromeda search engine (a peptide search engine based on probabilistic scoring) with the UniProt-SwissProt human canonical database as a reference and a contaminants database of common laboratory contaminants. MaxQuant reports summed intensity for each protein, as well as it`s iBAQ and LFQ values.
Proteins that share all identified peptides are combined into a single protein group. Peptides that match multiple protein groups (“razor” peptides) are assigned to the protein group with the most unique peptides. MaxQuant employs the MaxLFQ algorithm for label-free quantitation (LFQ). Quantification will be performed using razor and unique peptides, including those modified by acetylation (protein N-terminal), oxidation (Met) and deamidation (NQ).
In the MaxQuant output, iBAQ values indicate the absolute abundance of each protein within a sample, providing a measure of the total amount of protein present. Meanwhile, LFQ intensity values in the output tables reflect the relative abundance of each protein across different samples or conditions.
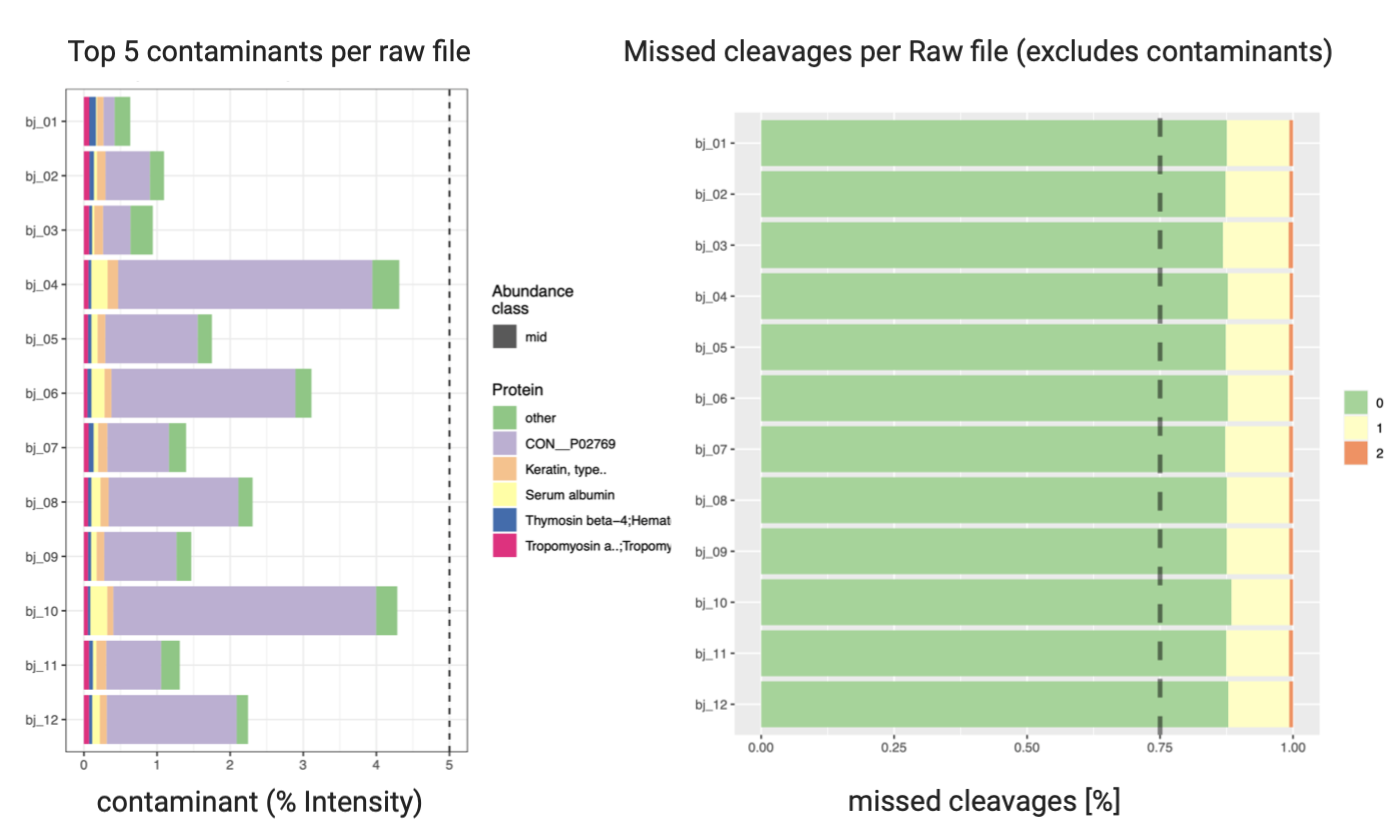
2. Quality Control of MaxQuant Search (optional)
PTXQC2 is an R package used for general quality control of proteomics data, which takes MaxQuant result files.
library("devtools")
install_github("cbielow/PTXQC", build_vignettes=TRUE, dependencies=TRUE)

library(PTXQC)
PTXQC::createReport("path_to_txt_directory")
Open final report file report_v1.0.5_combined.pdf
3. Post processing of MaxQuant Search results
Further data processing is performed using `Perseus v1.6.14.0)3. In brief, protein group LFQ intensities are log2-transformed to reduce the effect of outliers. To overcome the obstacle of missing LFQ values, missing values are imputed before fit the models. Hierarchical clustering is performed on Z-score normalized, log2-transformed LFQ intensities. Log ratios are calculated as the difference in average log2 LFQ intensity values between experimental and control groups. Two-tailed, Student’s t test calculations are used in statistical tests. A protein is considered statistically significant if its fold change is ≥ 2 and FDR ≤ 0.01. Please refer to its documentation for more details.
Export Perseus processed LFQ data as a text file Perseus_filtered_transformed_valid_values_imputed_ttest.txt
4. Perseus exported file processing
PerseusR enables the interoperability between the Perseus platform for omics data analysis (Tyanova et al. 2016). If you select “Write quality and imputed matrices” when you save Perseus processed data as a text file, inlude additionalMatrices=TRUE.
library(PerseusR)

setwd("/Users/Documents/Proteomics/Perseus")

inFile <- "Perseus_filtered_transformed_valid_values_imputed_ttest.txt"
mdata <- PerseusR::read.perseus.as.matrixData(inFile,additionalMatrices=TRUE,check = FALSE)

# 1. log(LFQ) data with imputed values
data <- main(mdata) # head(data)

# 2. Gene/Protein names, p-value, FDR and fold change
annotations <- annotCols(mdata) # colnames(annotations)

# Select first annotation in Protein.ID "sp|P31943|HNRH1_HUMAN;sp|Q9NQA5|TRPV5_HUMAN"
annotations$Protein.IDs <- sub(";.*","", annotations$Protein.IDs)

# Select Protein ID as HNRH1_HUMAN from sp|P31943|HNRH1_HUMAN;
annotations$Protein.IDs <- as.character(lapply(strsplit(as.character(annotations$Protein.IDs), split="\\|"),tail, n=1))

# Remove "_HUMAN" part HNRH1_HUMAN
annotations$Protein.IDs <- sub("_HUMAN","",annotations$Protein.IDs)

# Select Columns; write complete column name.
annotations <- annotations[,c("Protein.IDs","Student.s.T.test.p.value....", "Student.s.T.test.Difference...")]

# Save the data
write.table(annotations, file = "Volcano_plot_data.txt", col.names = TRUE, row.names = FALSE, quote = FALSE)
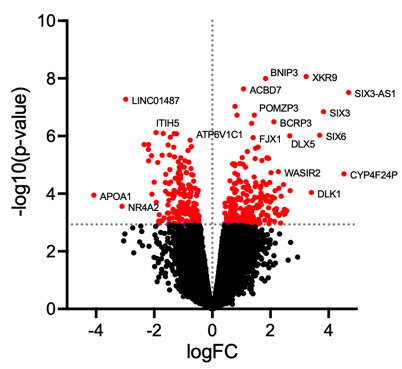
5. Data visualization
Volcano plot illustrates significantly differentially abundant proteins. The following plot is generated using GraphPad Prism.
In addition to the above analytical considerations, good experimental design helps effectively identify true differences in the presence of variability from various sources and also avoids bias during data acquisition.
Further reading…
MaxQuant – Information and Tutorial
How to use Cloud for Proteomics Data Analysis
Data dependent vs Data independent proteomics